Scientific initiative on Covid-19 - Facing The Virus: Second report released
Face Au Virus is an open scientific initiative launched by researchers from Université PSL (Dauphine - PSL, ENS - PSL, MINES Paris - PSL), CNRS and Inria, with a sponsorship from the company Emerton Data, with the objectives to contribute to general information on the Covid-19 outbreak as well as to help defining public policies for crisis management.

A key issue addressed by Face Au Virus is how to leverage mobility data in the modeling of the outbreak dynamics. To complement the health data provided by public authorities, the Initiative gathers additional data, provided by private companies (including Facebook), which enable the monitoring of the evolution of mobility according to its various characteristics.
Face Au Virus pays great attention to ensure that the use of data is carried out with respect for fundamental rights and freedoms and in no way aims to identify individual behavior. The scientists only work on statistic summaries on mobility data.
Following the first report on the analysis of mobility during the first wave of the Covid-19 epidemic published in May 2020, the scientists publish a new report that sheds light on the dynamics of the epidemic during the second wave. This new study focused on the analysis of two main issues :
- The impact of government measures (lockdown, lifting of the lockdown, curfew, etc.) on the dynamics of the virus' spread via a retrospective analysis of the different phases of the epidemic from March to October 2020, based on robust statistical modeling to detect changes in dynamics in hospitalization data, at national, regional or departmental levels.
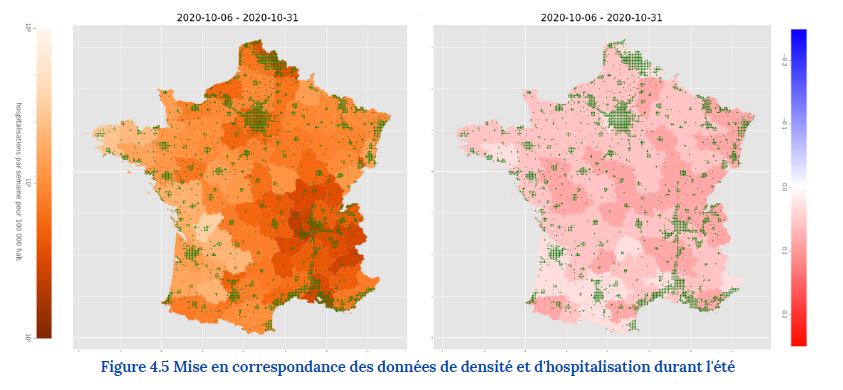
- The role of population density in the dynamics of the spread of the virus. To this end, the scientific team developed indicators to measure changes in the distribution of densely populated areas on French territory by using geolocation data provided by Facebook as part of the "Data for Good" program, and also linked these indicators to the results of statistical modeling of the different phases of the epidemic.
Main conclusions
During the first wave of the epidemic, the dates of change in epidemic dynamics can be directly related to government policies, with the most visible change happening with the first lockdown. A turning point is observed from the second half of August onwards. The second wave is characterized by phenomena of geographical redistribution in the areas heavily impacted by the epidemic and changes that no longer seem to be directly related to epidemic control policies.
The analysis at regional and departmental levels of the changes that occurred during the summer and in September reveals strong territorial disparities, with epidemic dynamics carried by territories that were often little impacted during the first wave. The analysis of geolocation data confirms significant movements (with a peak in mid-August) of the population from the northern regions of France and major cities towards coastal regions. During the summer period, the population density decreased by more than 25% in an important part of the territory compared to the reference date taken on March 22 (during the lockdown) with usual high density areas (large cities) that have depopulated to the benefit of some coastal areas.
With regard to the impact of population density on epidemic dynamics, the conclusions are mixed. While the presence of high-density areas in a territory does appear to be a factor correlated with the speed of spread of the epidemic during the first wave, the situation is more complex during the second wave of the epidemic. Nevertheless, over the entire period, the highest hospitalization rates in relation to the number of inhabitants are frequently observed in the most densely populated areas.

Contacts
- Scientific contact: Jamal Atif
- Communication contact: Université PSL
